Free Shopify Customer Demographics Reports (Powered by PostPilot)
·
·
Mar 19, 2025
We’re back to show off some more free PostPilot reports.
And they’re incredibly cool: granular Shopify customer demographics reports that tell you dozens of things about your customer base. From education to income. Pets to kids.
Does anyone remember the good ol’ days when Facebook had this data?
We had to bring those reports back (and we added a ton of others, too).
PostPilot provides access to an extremely comprehensive data set, covering most US customers. It reflects years of meticulous work, partnering with top data providers, and validating the data with thousands of tests.
Reports are accessible via the PostPilot UI and clicking on “PostPilot AI: Customer Insights.” Pictured is a real, anonymized account.
Here are the categories of reports that are available:
Customer Demographics: Get a granular look at where your customers are (and where you sell the most), % of customers by age range, income level, residence, and family structure.
Buying Behavior: AKA what people buy, what mass retailers (e.g., Target) they shop at, and even how much they spend (AOV) in those retailers.
Life Events: See which of your customers are new parents, have kids starting college, recently moved, got married, and more.
Personal Interests: Check out your customers’ hobbies and interests (ranging from sports to travel to reading).
In this piece, though, we’re focusing on the Shopify Customer Demographics Reports.
Reports Overview
How you get there: These reports can be found in the first tab of the PostPilot Customer Insights section:
And hey, there’s a preview of some of the data, which includes the Top 10 States you sell in, compared to your category (e.g., apparel) and the average American consumer.
Now, let’s look at a few of the other reports.
Note that we won’t cover all of them here because there are a lot, but we’ll cover some popular ones.
Customers’ Ages
This report can be (quite) surprising for brands.
Do you actually know how old your customers are?
After looking at this report, we’ve had brands tell us that their customers are actually substantially younger or older than they originally thought.
The result (and some ideas for you): A couple brands have started to develop new products that may be more relevant to customers based on their (actual) ages, and they’ve invested more into customer research/surveys to dial in messaging.
Household Income and Net Worth
Understanding your customers’ current earnings and household net worth is fundamental to long-term strategy.
Some ideas:
More higher earning/high net worth customers: Might be more receptive and likely to buy higher-ticket items and generally less price sensitive. From an acquisition standpoint, this means we (PostPilot) can build direct mail prospecting campaigns targeting those high net income individuals.
For lower earners/lower net worth customers: May be more discount-seeking or may exclusively buy on discounts (recommendation: bundles with deeper discounts still mean way higher AOV) aside from certain household necessities/CPG products.
Either way, take particular note over the holidays. You also may be able to segment your first-party transactional data into “Has Discounted vs. Never Discounted” and create targeted offers over the holidays to potentially save a bunch of margin.
Marital Status
Ideas:
Married customers: May be interested in family-oriented products, buying for a household, and/or showing over-25 people in product and marketing photos.
Married customers, part two: A rightfully classic move is to send gift buying offers to customers if they’re married. If this is relevant data for your brand, you can segment based on who opened/engaged with your gifting campaigns and create further campaigns around gifting. By the way - direct mail works great for this. M&S Meats launched gifting campaigns that drove 110% more holiday sales YoY:
Single customers: May be interested in solo-use/individualistic items for social activities.
Pets
Probably most relevant for pet brands, but… You never know.
Ideas:
If you’re a pet brand, this might be zero-party data you could collect in a pop-up with a discount code. For example, if you have your standard “Get X% off your first order if you sign up for our list,” throw in “What kind of pet parent are you?” plus options for dog/cat/both/other.
If you’re not a pet brand, if you find a large % of your customer base has pets, you can even test some pet-themed campaigns relevant to your brand for a bit of lighthearted and easy engagement.
Number of Kids
More kids, more people to buy for.
Ideas:
If you happen to have an unusually high number of customers with more kids, you might benefit from offering family bundles (great for certain consumables, apparel, and more) with solid discounts. If you can sell 3x as much, even at a 20% discount, you’re still massively increasing AOV per sale.
More kids could potentially inform more family-centric or occasionally family-centric messaging and campaigns.
On the other hand, if more customers are childless, messaging may be more effective when focusing on individual/couples’ lifestyles.
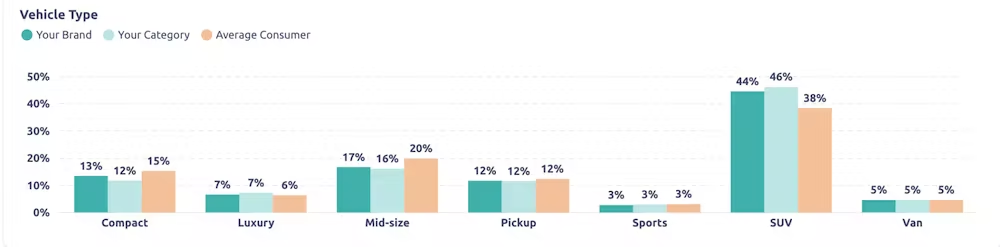
Vehicle Type
Great for car accessory brands, of course, but great intel for everyone else.
Ideas:
If your customer base owns more SUVs and has more kids, that might be another great bundle opportunity. Road trips, beach, other family vacations, after-school sports practices, and day-to-day life.
For automotive brands, this may guide some offerings. More pickups? Potentially worth testing more outdoors or blue-collar messaging. More compact cars? Offer more space savers.
Get These (And Many More) Shopify Demographic Reports for Free
Like what you see? Did we mention they’re free? No credit card? As in, no money required?
Connect your Shopify store to your PostPilot account.
Let your data sync.
PostPilot AI reports will begin populating— you should be able to access them within a day or two.
Literally, that’s it.
No, there is no catch.
Hooooooowever, if you happen to be interested in adding direct mail to your marketing strategy (and adding 10% to your revenue this year), read more about PostPilot.